Sometimes it is desirable to show Axes overlaying the chart area. This may be the case, for example, when the charting area must occupy all the space available. In other cases, there may be a need to place Axes in the center of the charting area. This article explains how to achieve this with SciChart.
Understanding Axis Layout
Inside a SciChartSurface, X and Y Axes can be placed in Axis Areas, as depicted below:
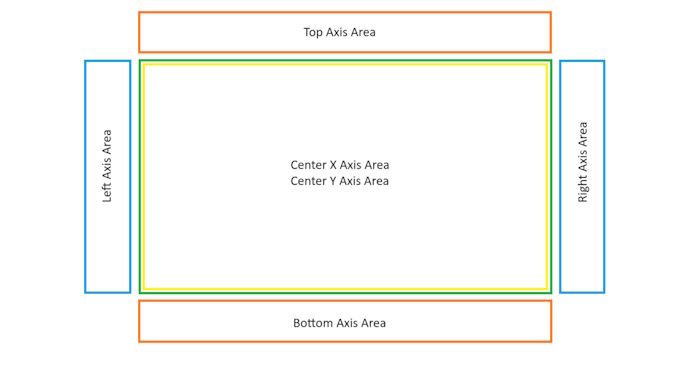
The AxisAlignment property of the Axis determines which Axis Area is chosen. To place an Axis inside the Center Axis Area, the IsCenterAxis property must be set to "True" on the Axis. In this case, AxisAlignment determines the direction which Axis Ticks and Labels will face.
Placing Axis Inside the Chart
Please follow the steps below that are required in order to add an Axis to a Center Axis Area:
- Set IsCenterAxis property to "True" on an Axis
- Provide a custom Panel via the CenterAxesPanelTemplate property on SciChartSurface (only Canvas is supported at the moment)
- Position the Axis inside the Canvas with Canvas.Left, Canvas.Top, Canvas.Right, Canvas.Bottom attached properties
- Specify the side on which Axis Ticks and Labels will appear by setting the AxisAlignment property on the Axis
Examples
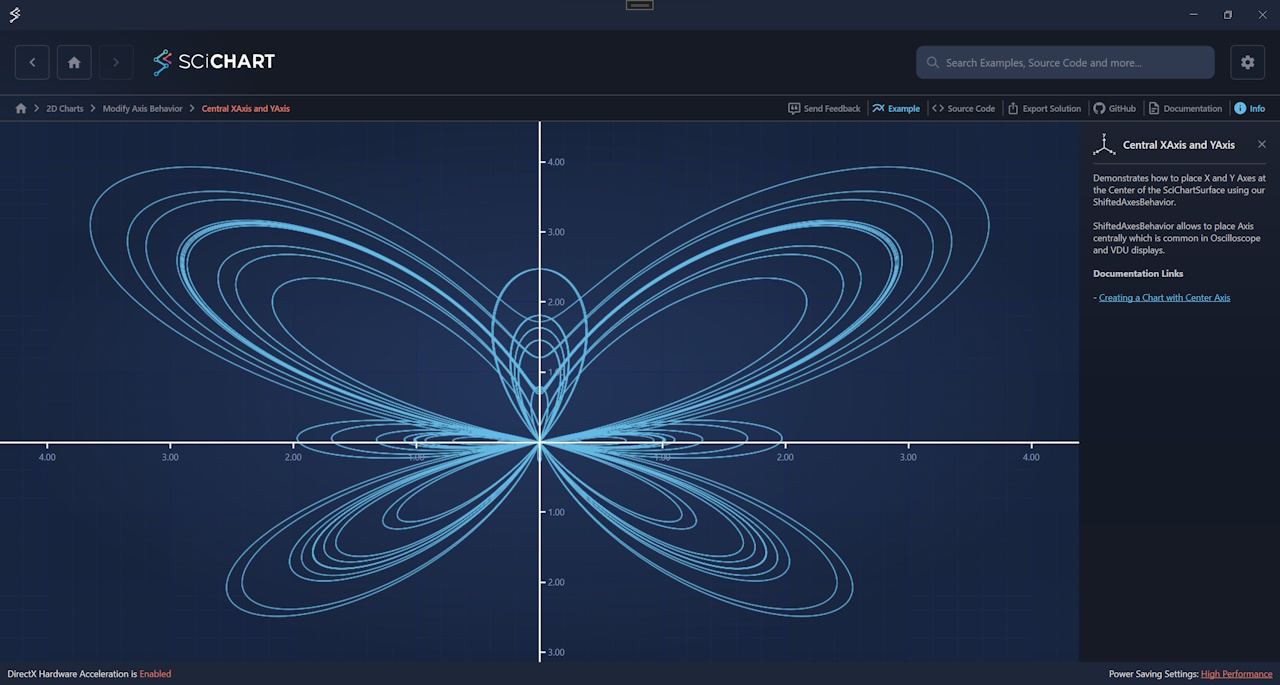
- “Central XAxis and YAxis” example demonstrates how to make a chart with XAxis and YAxis in the center
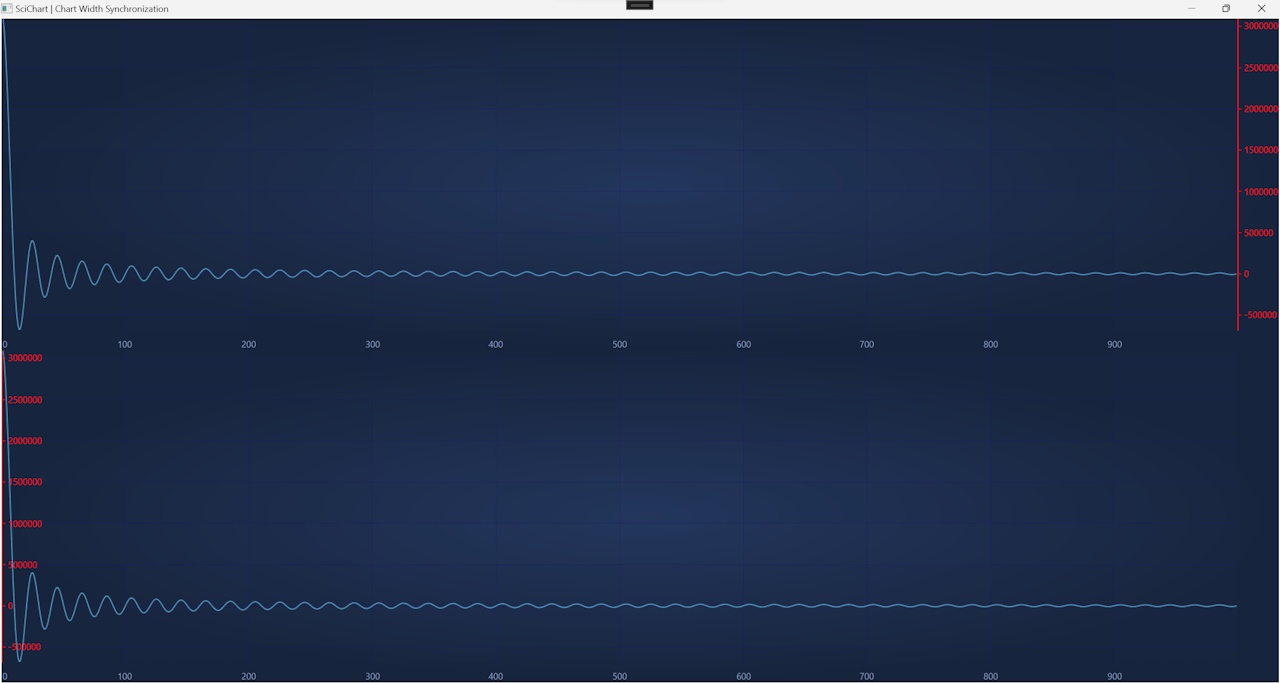
- “Chart Width Synchronization” example demonstrates how to make a chart with YAxis turned inwards, thus appearing on top of the charting area